

Residential Real Estate Statistics | Hamilton, Burlington & Area
Year-To-Date Residential Prices – July 2026
With the first seven months of the year now complete, these figures reflect combined market activity for January through July.
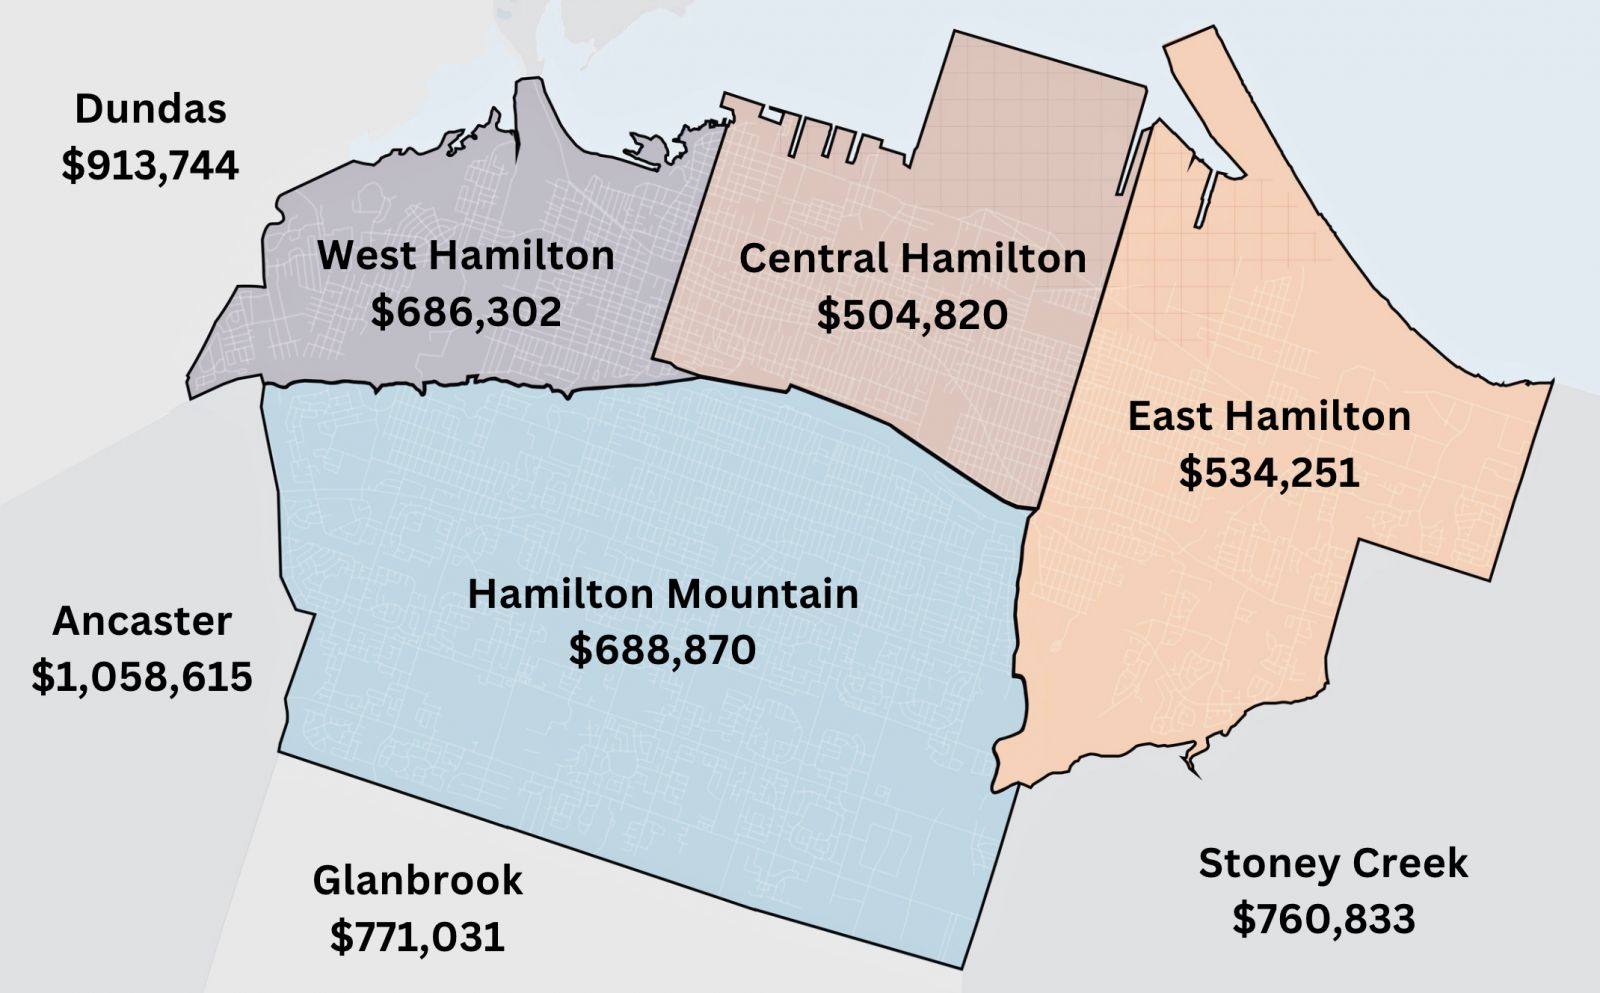
Average price statistics are a directional tool. Track them month over month and year over year, and you can see whether values across an entire area are rising, holding, or easing. What they can't do is put a number on your home. Two houses on the same street can sell for tens of thousands of dollars apart, depending on condition, layout, lot, and timing alone, and a district average quietly absorbs it all. The mix of what sold moves the figure just as much. A month weighted toward detached or higher-end sales lifts the average without any single property gaining value, and a run of condo or entry-level closings drags it down the same way. Read these numbers for the trend, then look to the comparables that actually match your property for its value. The trend shows you the direction. The comparables show you the price.
|
Area
|
2026
|
2025
|
2024
|
|
Cornerstone Hamilton-Burlington Region
|
$831,483
|
$860,795
|
$884,614
|
|
Hamilton Region
|
$746,086
|
$786,337
|
$809,263
|
|
Hamilton City
|
$646,229
|
$689,685
|
$711,135
|
|
Burlington
|
$1,107,708
|
$1,134,497
|
$1,134,756
|
|
Ancaster
|
$1,058,615
|
$1,147,927
|
$1,201,502
|
|
Dundas
|
$913,744
|
$979,307
|
$920,527
|
|
Flamborough
|
$1,289,339
|
$1,267,789
|
$1,287,283
|
|
Waterdown
|
$966,472
|
$969,292
|
$984,770
|
|
Grimsby
|
$777,486
|
$847,311
|
$876,643
|
|
Glanbrook
|
$771,031
|
$860,707
|
$892,804
|
|
Stoney Creek
|
$760,833
|
$814,889
|
$828,103
|
|
Caledonia
|
$713,386
|
$749,976
|
$791,405
|
|
Cayuga
|
$783,717
|
$821,813
|
$838,415
|
|
Dunnville
|
$597,156
|
$614,034
|
$625,671
|
Market Overview - July 2026
"Sales activity in the Hamilton-Burlington area market saw a pullback in July, with an 11.0% decline year-over-year, while new listings also continued to tighten, falling 17.6% compared to the same period last year," said Bill Duce, CEO of Cornerstone Association of Realtors. "At 4.6 months of supply, inventory remains high by Hamilton-Burlington's historical standards, giving buyers more choice and creating more buyer-friendly conditions than we have typically seen in this market. However, affordability challenges continue to temper demand, with many prospective buyers still cautious despite improved selection. As always, market conditions can vary significantly from neighbourhood to neighbourhood, which is why it's important to work with a local REALTOR®."
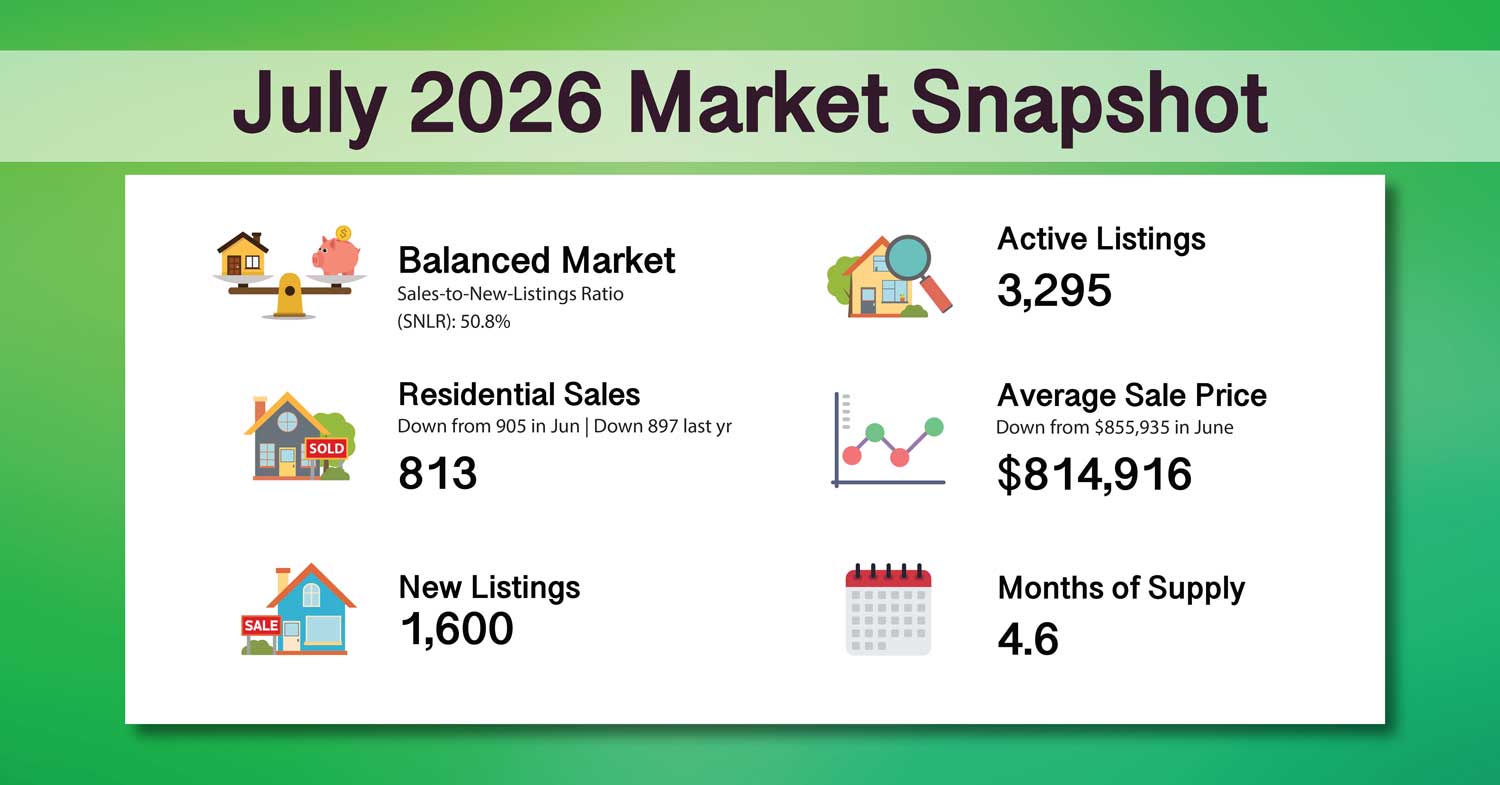
July brought a real pullback after June's rebound. Sales dropped to 813, down 10.2% from June's 905 and down 9.4% from July 2025's 897. New listings tightened even further, down 17.0% from June. That combination pushed the region's SNLR up to 50.8%, the tightest it's been all year, even though fewer homes are actually changing hands.
Sales Activity
813 residential properties sold across the Cornerstone Hamilton-Burlington Region in July.
-
Down 10.2% from 905 sales in June 2026
-
Down 9.4% compared to 897 sales in July 2025
By Area
|
Area
|
July 2026
|
June 2026
|
July 2025
|
|
Hamilton Region
|
301
|
346
|
387
|
|
Burlington
|
180
|
240
|
216
|
|
Ancaster
|
53
|
54
|
48
|
|
Dundas
|
31
|
30
|
26
|
|
Flamborough
|
16
|
12
|
18
|
|
Waterdown
|
38
|
33
|
29
|
|
Grimsby
|
28
|
34
|
44
|
|
Glanbrook
|
41
|
41
|
28
|
|
Stoney Creek
|
63
|
74
|
67
|
|
Caledonia
|
15
|
10
|
13
|
|
Cayuga
|
3
|
4
|
8
|
|
Dunnville
|
16
|
21
|
19
|
Burlington saw the sharpest pullback among the larger markets, down 16.7% year-over-year. Waterdown moved the opposite direction entirely, sales up 31% from last July, the strongest gain in the region.
Pricing Trends
The average residential sale price in July was $814,916, down from $855,935 in June and down from $845,154 in July 2025.
|
Area
|
July 2026
|
July 2025
|
Change
|
|
Cornerstone Hamilton-Burlington Region
|
$814,916
|
$845,154
|
-3.6%
|
|
Hamilton Region
|
$748,928
|
$771,651
|
-2.9%
|
|
Hamilton City
|
$654,756
|
$674,637
|
-2.9%
|
|
Burlington
|
$1,046,217
|
$1,105,687
|
-5.4%
|
Hamilton Region and Hamilton City declined at almost exactly the same rate this month, both down 2.9%, suggesting the softening is spread fairly evenly across the urban core and the outlying communities rather than concentrated in one or the other. Burlington pulled back the hardest of any area, down 5.4% year-over-year, a real departure from May's pattern, when Burlington was the one area posting a year-over-year price gain.
Month-to-month price movements will always fluctuate. Average sale price is best read as a trend indicator, not a precise valuation tool.
New Listings
1,600 new residential listings came to the market in July.
-
Down 17.0% from 1,928 listings in June 2026
-
Down from 1,938 in July 2025
By Area
|
Area
|
July 2026
|
June 2026
|
July 2025
|
|
Hamilton Region
|
640
|
759
|
845
|
|
Burlington
|
324
|
418
|
395
|
|
Ancaster
|
112
|
126
|
112
|
|
Dundas
|
37
|
45
|
39
|
|
Flamborough
|
41
|
43
|
46
|
|
Waterdown
|
54
|
80
|
75
|
|
Grimsby
|
70
|
81
|
80
|
|
Glanbrook
|
67
|
78
|
73
|
|
Stoney Creek
|
146
|
175
|
213
|
|
Caledonia
|
21
|
44
|
31
|
|
Cayuga
|
10
|
11
|
11
|
|
Dunnville
|
46
|
38
|
35
|
New listings pulled back sharply across nearly every area this month, most notably Caledonia, down more than half from June's 44 to just 21, which is a major driver behind that area's tightening market conditions this month.
Inventory and Months of Supply
Active listings reached 3,295 by the end of July, putting the region at 4.6 months of supply, down from 4.8 in June.
|
Area
|
Active 2026
|
MOS 2026
|
Active 2025
|
MOS 2025
|
Active 2024
|
MOS 2024
|
|
Cornerstone Hamilton-Burlington Region
|
3,295
|
4.6
|
3,803
|
5.0
|
3,148
|
3.9
|
|
Hamilton Region
|
1,322
|
4.6
|
1,570
|
5.0
|
1,197
|
3.8
|
|
Burlington
|
586
|
3.5
|
738
|
4.3
|
589
|
3.2
|
|
Ancaster
|
226
|
5.7
|
252
|
6.4
|
189
|
4.7
|
|
Dundas
|
71
|
3.5
|
69
|
2.9
|
53
|
2.2
|
|
Flamborough
|
136
|
8.9
|
145
|
8.3
|
152
|
8.2
|
|
Waterdown
|
109
|
4.0
|
127
|
4.4
|
135
|
5.0
|
|
Grimsby
|
135
|
5.2
|
153
|
4.8
|
178
|
5.0
|
|
Glanbrook
|
141
|
4.8
|
142
|
4.8
|
120
|
3.6
|
|
Stoney Creek
|
316
|
5.2
|
425
|
6.3
|
330
|
4.3
|
|
Caledonia
|
84
|
6.8
|
60
|
4.3
|
45
|
3.4
|
|
Cayuga
|
30
|
7.1
|
36
|
6.9
|
35
|
7.0
|
|
Dunnville
|
99
|
6.8
|
92
|
6.3
|
108
|
8.0
|
Caledonia's months of supply has climbed steadily for three straight years, from 3.4 in 2024 to 6.8 now, the clearest ongoing supply trend in the region. Dundas remains the tightest market at 3.5 months.
Days On Market
Homes took an average of 42 days to sell across the region in July, up from 38 in 2025 and 30 in 2024.
|
Area
|
2026
|
2025
|
2024
|
|
Cornerstone Hamilton-Burlington Region
|
42
|
38
|
30
|
|
Hamilton Region
|
42
|
37
|
28
|
|
Burlington
|
39
|
36
|
27
|
|
Ancaster
|
38
|
42
|
27
|
|
Dundas
|
44
|
41
|
37
|
|
Flamborough
|
55
|
52
|
50
|
|
Waterdown
|
33
|
39
|
28
|
|
Grimsby
|
42
|
39
|
29
|
|
Glanbrook
|
43
|
42
|
25
|
|
Stoney Creek
|
48
|
33
|
27
|
|
Caledonia
|
41
|
39
|
43
|
|
Cayuga
|
26
|
59
|
35
|
|
Dunnville
|
41
|
45
|
35
|
Ancaster is the only area where days on market improved year-over-year, down to 38 from 42. Cayuga saw the sharpest improvement of any area, dropping from 59 days last year to just 26.
SNLR Market Conditions
The Sales-to-New-Listings Ratio, or SNLR, is how we measure whether buyers or sellers hold the advantage. Above 60% signals a seller's market, below 40% signals a buyer's market, and anything in between is balanced.
|
Area
|
Sales
|
New Listings
|
SNLR
|
Market Type
|
|
Cornerstone Hamilton-Burlington Region
|
813
|
1,600
|
50.8%
|
Balanced
|
|
Hamilton Region
|
301
|
640
|
47.0%
|
Balanced
|
|
Burlington
|
180
|
324
|
55.6%
|
Balanced
|
|
Ancaster
|
53
|
112
|
47.3%
|
Balanced
|
|
Dundas
|
31
|
37
|
83.8%
|
Sellers
|
|
Flamborough
|
16
|
41
|
39.0%
|
Buyers
|
|
Waterdown
|
38
|
54
|
70.4%
|
Sellers
|
|
Grimsby
|
28
|
70
|
40.0%
|
Balanced
|
|
Glanbrook
|
41
|
67
|
61.2%
|
Sellers
|
|
Stoney Creek
|
63
|
146
|
43.2%
|
Balanced
|
|
Caledonia
|
15
|
21
|
71.4%
|
Sellers
|
|
Cayuga
|
3
|
10
|
30.0%
|
Buyers
|
|
Dunnville
|
16
|
46
|
34.8%
|
Buyers
|
The region moved firmly toward balanced-tight territory this month, up from 43.7% in June. Several smaller areas swung into seller's territory on thin volume, worth reading with the usual caution around small sample sizes.
Notable Movements
Caledonia reversed course entirely this month. After sitting in buyer's territory through the mid-year report, a sharp pullback in new listings, down more than half from June, flipped its SNLR to 71.4%, squarely in seller's territory. Worth watching whether this holds or was a single thin month.
Dundas posted the tightest SNLR in the region at 83.8%, on just 37 new listings. A genuinely tight month, though the small sample means it's worth framing as a snapshot rather than a structural shift.
Ancaster was the only area with improving days on market this month, down to 38 from 42 a year ago, even as most of the region slowed down.
Waterdown posted the strongest sales gain in the region, up 31% year-over-year, while also moving into seller's territory at 70.4% SNLR,
West Lincoln sales more than doubled year-over-year, 21 versus 9, the sharpest volume increase anywhere in this data set, alongside a meaningful price gain.
Neighbourhood Snapshot
Area |
July 2026 Sales |
July 2026 New Listings |
Average Price |
DOM |
SNLR
|
|
Cornerstone Hamilton-Burlington Region
|
813
|
1,600
|
$814,916
|
42
|
50.8%
|
|
Hamilton Region
|
301
|
640
|
$746,086
|
42
|
47.0%
|
|
Burlington
|
180
|
324
|
$1,107,708
|
39
|
55.6%
|
|
Ancaster
|
53
|
112
|
$1,058,615
|
38
|
47.3%
|
|
Dundas
|
31
|
37
|
$913,744
|
44
|
83.8%
|
|
Flamborough
|
16
|
41
|
$1,289,339
|
55
|
39.0%
|
|
Waterdown
|
38
|
54
|
$966,472
|
33
|
70.4%
|
|
Grimsby
|
28
|
70
|
$777,486
|
42
|
40.0%
|
|
Glanbrook
|
41
|
67
|
$771,031
|
43
|
61.2%
|
|
Stoney Creek
|
63
|
146
|
$760,833
|
48
|
43.2%
|
|
Caledonia
|
15
|
21
|
$713,386
|
41
|
71.4%
|
|
Cayuga
|
3
|
10
|
$783,717
|
26
|
30.0%
|
|
Dunnville
|
16
|
46
|
$597,156
|
41
|
34.8%
|
Average price is calculated by dividing total dollar volume by number of sales for the period.
Hamilton City Detail - Urban Core Breakdown
New this month: a closer look at Hamilton's urban core, separate from the wider Hamilton Region figure above.
Sales and Average Price
|
Sub-Area
|
Sales 2026
|
Sales 2025
|
Avg Price 2026
|
Avg Price 2025
|
|
West Hamilton
|
39
|
51
|
$695,746
|
$681,673
|
|
East Hamilton
|
60
|
62
|
$510,659
|
$583,384
|
|
Central Hamilton
|
47
|
66
|
$478,234
|
$500,019
|
|
Hamilton Mountain
|
124
|
154
|
$712,256
|
$715,361
|
New Listings
|
Sub-Area
|
July 2026
|
July 2025
|
|
West Hamilton
|
86
|
107
|
|
East Hamilton
|
109
|
130
|
|
Cenral Hamilton
|
127
|
164
|
|
Hamilton Mountain
|
241
|
313
|
Active Listings and Months of Supply
|
Sub-Area
|
Active 2026
|
MOS 2026
|
Active 2025
|
MOS 2025
|
Active 2024
|
MOS 2024
|
|
West Hamilton
|
200
|
5.7
|
246
|
6.7
|
183
|
4.6
|
|
East Hamilton
|
231
|
4.7
|
230
|
4.1
|
165
|
3.1
|
|
Cenral Hamilton
|
268
|
4.8
|
311
|
5.5
|
290
|
4.5
|
|
Hamilton Mountain
|
436
|
3.7
|
518
|
4.3
|
341
|
2.9
|
Days on Market
|
Sub-Area
|
2026
|
2025
|
2024
|
|
West Hamilton
|
61
|
37
|
31
|
|
East Hamilton
|
38
|
38
|
27
|
|
Cenral Hamilton
|
43
|
40
|
28
|
|
Hamilton Mountain
|
36
|
36
|
23
|
Central Hamilton is now the most affordable sub-area in the urban core, average price just under $478,000. Central and East Hamilton both saw meaningful year-over-year price declines alongside falling sales, worth watching over the next few months.
West Hamilton stands out for a different reason: days on market jumped to 61 in 2026 from 37 in 2025, nearly double every other sub-area in the urban core. That's the sharpest single-year change anywhere in this month's data and worth its own mention rather than folding it quietly into the averages.
Also within Cornerstone Hamilton-Burlington Region (Haldimand and Niagara North detail):
|
Area
|
Sales 2026
|
Sales 2025
|
Avg Price 2026
|
Avg Price 2025
|
|
Hagersville
|
6
|
7
|
$566,900
|
$580,429
|
|
West Lincoln
|
21
|
9
|
$873,071
|
$784,200
|
Year-To-Date Market Context
Seven months into 2026, the picture continues to shift:
-
The region moved into tighter balanced territory in July, SNLR up to 50.8% from 43.7% at mid-year
-
New listings are pulling back faster than sales, which is driving the tightening rather than a genuine surge in demand
-
Several smaller areas, Dundas, Waterdown, Glanbrook, and Caledonia, moved into seller's territory this month, though on lower sales volume where month-to-month swings are more pronounced
-
Ancaster remains the standout for pricing discipline, the only area with improving days on market
-
Hamilton's urban core (Hamilton City) is now being reported separately from the wider Hamilton Region figure for greater clarity going forward
Local Market Observations
July told two different stories depending on which side of the transaction you're on.
For buyers, the region as a whole is still balanced, but new listings pulled back harder than sales did this month, which is starting to tighten things in specific pockets. Caledonia is the clearest example. It was one of the most buyer-friendly markets in the region back in June, and by July it had flipped into seller-favourable territory almost entirely because new listings dried up. Dundas told a similar story, an unusually tight month where demand outpaced the thin supply of new listings coming in. If you've been house hunting in either of those areas expecting the leverage you had a month ago, it's worth re-checking current listings before assuming that's still the case. On the other hand, Flamborough, Cayuga, and Dunnville all remain firmly in buyer's territory, and West Lincoln, despite tightening prices, still has real room for negotiation given how few sales are closing there relative to what's listed.
For sellers, pricing discipline is still the difference between a home that sells and one that sits. Ancaster is the standout this month, the only area where days on market actually improved year-over-year, even as nearly every other area slowed down. That's what happens when local agents and sellers stay realistic about where the market actually is. Compare that to areas like Flamborough and Stoney Creek, both taking noticeably longer to sell than they were a year ago. If you're listing in one of the slower-moving areas right now, expect to compete on price and presentation, not just location.
Region-wide, July's numbers show a market cooling slightly from June's pace, sales down, new listings down further, average price pulled back from June's high. That's not a market losing confidence. It's a market moving into its usual summer rhythm. The bigger story continues to be how differently that plays out block by block. Hamilton Region and Burlington are holding steady in balanced territory, but underneath that headline number, several smaller communities are swinging hard in one direction or the other on relatively low sales volume. That's exactly why a single area's numbers should never be read in isolation from what's happening two neighbourhoods over.
This is the thread running through every section above. Caledonia and Dundas look nothing alike this month despite sitting a few kilometres apart. Ancaster is selling faster while Flamborough and Stoney Creek are taking longer. A regional average tells you the temperature of the market, but it can't tell you what's happening on a specific street, in a specific price range, for a specific property. That takes local knowledge, knowing which neighbourhoods are absorbing new listings quickly, which price points are drawing multiple offers, and which are sitting. Whether you're pricing a home to sell or deciding how hard to negotiate on one you want to buy, that's the difference between working off a headline number and working off what's actually happening where you are.
June 2026 Mid-Year Report - Click Here
Want a Closer Look?
Wondering what your home is worth in this market? Get a current pricing analysis for your neighbourhood.
- Request a neighbourhood-specific market analysis
- Get set up on instant listing notifications, so you see new homes the moment they hit the market
- Explore Hamilton Real Estate Trends
Hamilton Real Estate Price History Since 1990
Monthly Market Updates
Annual Market Reviews
The statistics provided are based on information from the ITSO MLS System, of which Cornerstone Hamilton-Burlington is a proud founding member. This data covers the Hamilton-Burlington-Haldimand-